
Navigating Your First Chart: A Beginner’s Guide to Using TradingView Tools
May 25, 2025

TradingView Tools: Your First Steps into Charting and Market Analysis
The first time you open TradingView tools, the interface might feel like walking into the cockpit of a plane. Dozens of charts, buttons, and indicators are right there on the screen. But underneath the surface is something surprisingly intuitive—especially for beginners who want to understand how financial markets move.
Whether you’re trying to analyze forex pairs like USD/VND or following the VN-Index, the visual experience that TradingView provides can turn complicated data into something you can actually read and learn from. This tutorial is written with beginners in mind—people curious about charting, not yet trading professionally. Let’s explore how to start with TradingView tools in a way that’s clear, useful, and adaptable to a Vietnamese trading context.
What Is TradingView, and Why Do People Use It?
TradingView is a web-based charting platform used by traders and investors around the world. It supports a range of financial markets—stocks, forex, indices, crypto, and more—and gives users the tools to visually interpret price data through charts, indicators, and overlays.
But more than just a charting software, TradingView is also a place to think, observe, and experiment. Beginners often find it helpful because they can explore market behavior without immediately placing real trades. It’s a kind of “learning lab” where you can watch how the VN-Index reacts to news, or how a currency pair like EUR/USD behaves during market hours—all without pressure.
A Quick Walkthrough of the TradingView Tools Interface
Credit from TradingView
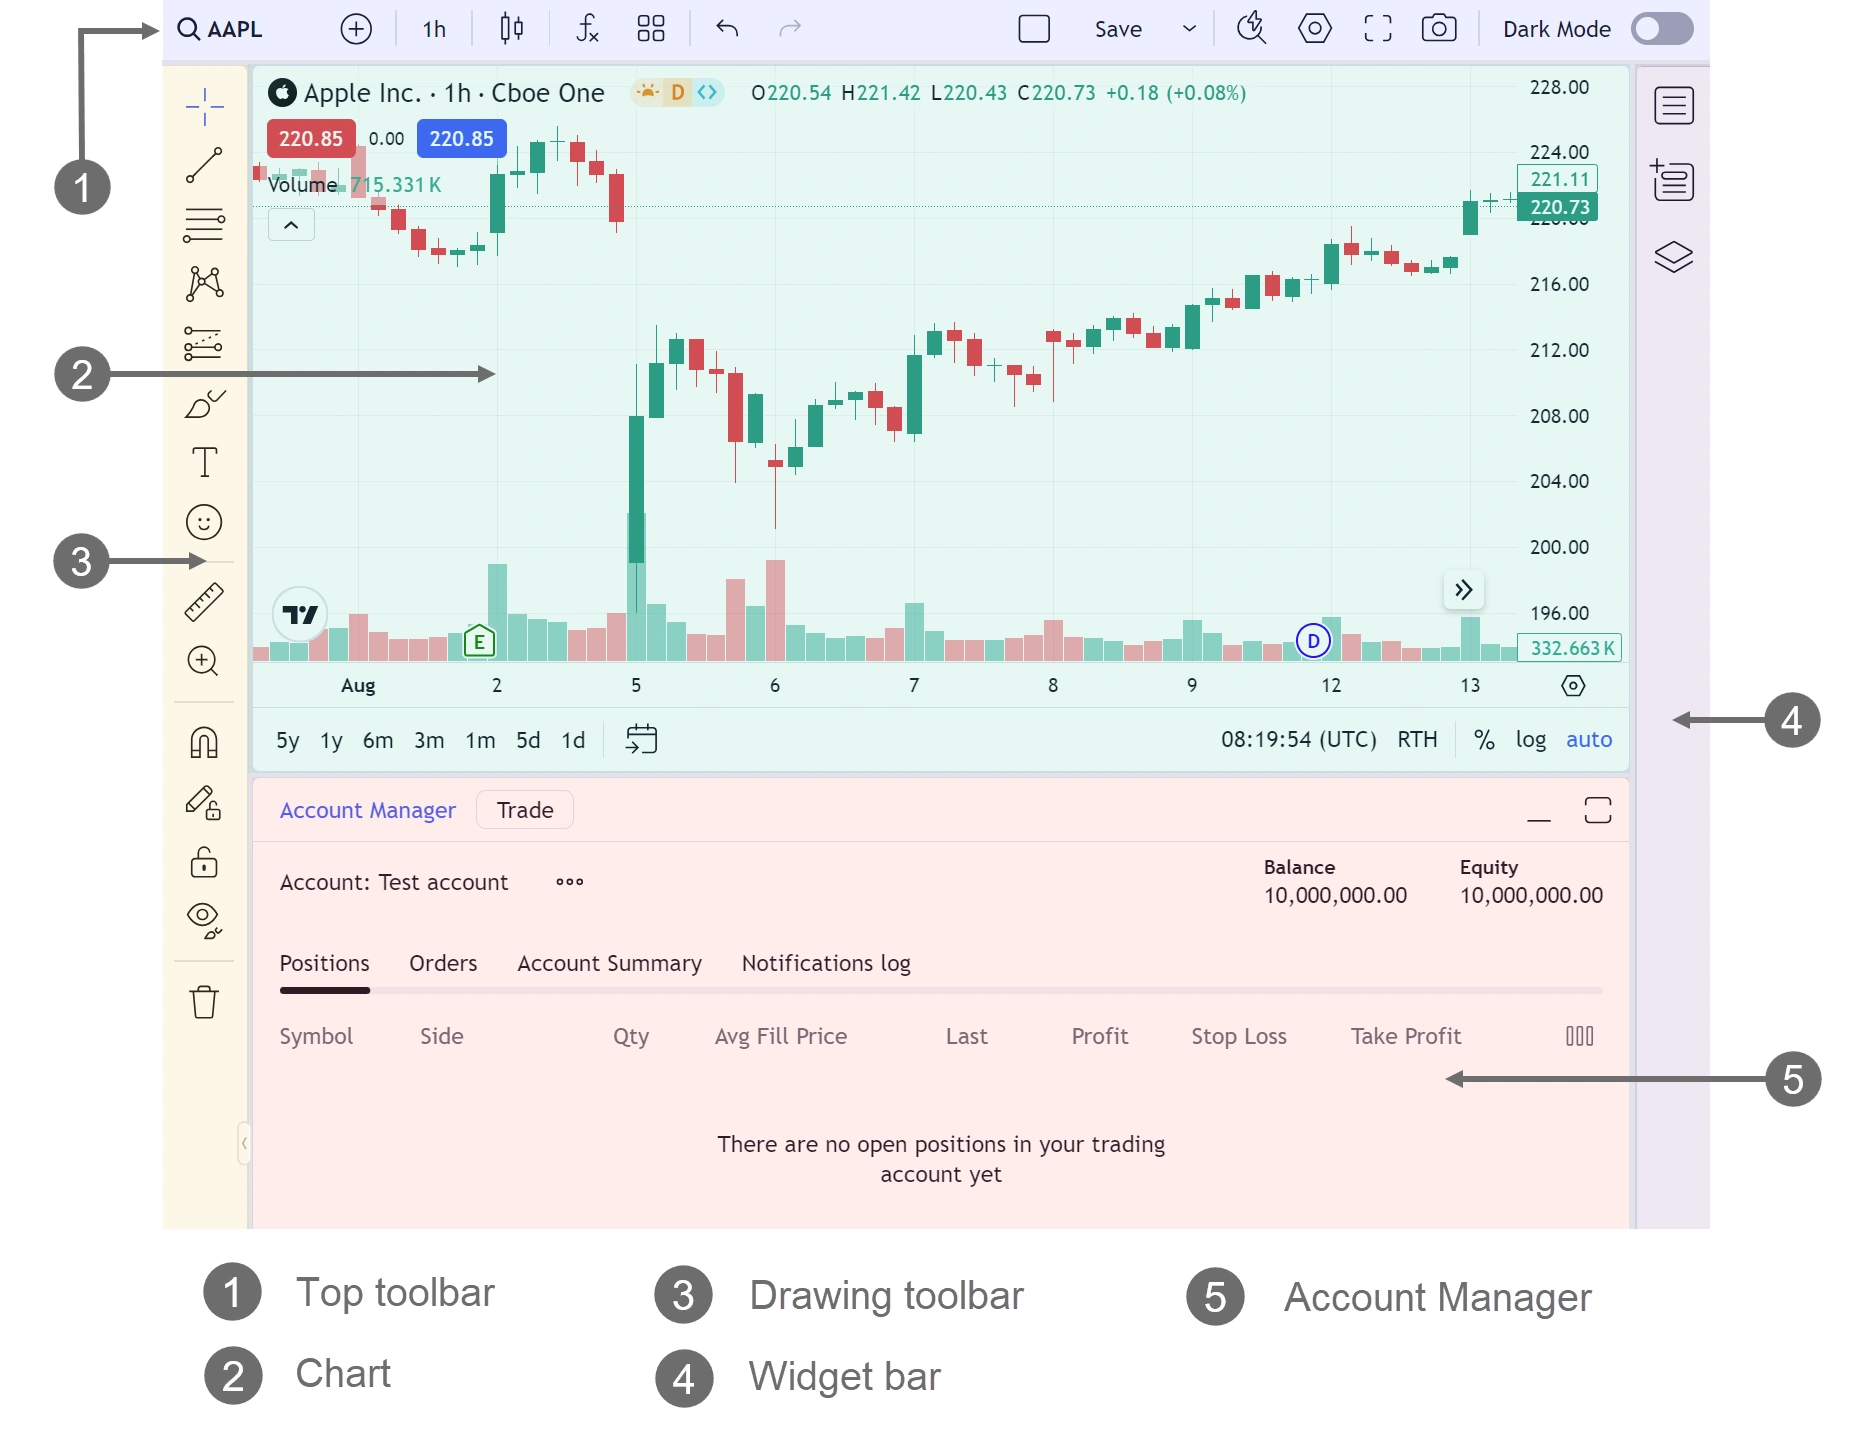
Once you load your first chart, you’ll notice the screen is divided into several key areas. It’s worth getting familiar with these early on.
The main area is, of course, the price chart. But around it are important toolbars:
- On the left, you’ll find drawing tools. These are things like trendlines, rectangles, arrows, and Fibonacci retracements—helpful for marking key price areas.
- Along the top, you can search for trading symbols (like VNINDEX or USD/VND), choose time frames, and change the chart type (candlestick, bar, line, etc.).
- On the right, there’s a watchlist, an alert system, and even a social feed where you can see what other traders are thinking.
- At the bottom, advanced tools like the Pine Script editor (for coding custom indicators) are available, though beginners rarely use this at first.
You don’t need to master all of this right away. Most people start by simply watching how prices move over time—and that alone can teach you more than you expect.
Choosing What to Look At: Symbols and Timeframes
Credit from TradingView
To explore a market, you start by typing a symbol into the search bar at the top. This could be something local, like the VNINDEX or VNM stock, or a forex pair like USD/VND. TradingView will show you results from different exchanges, and you can choose which one you want to follow.
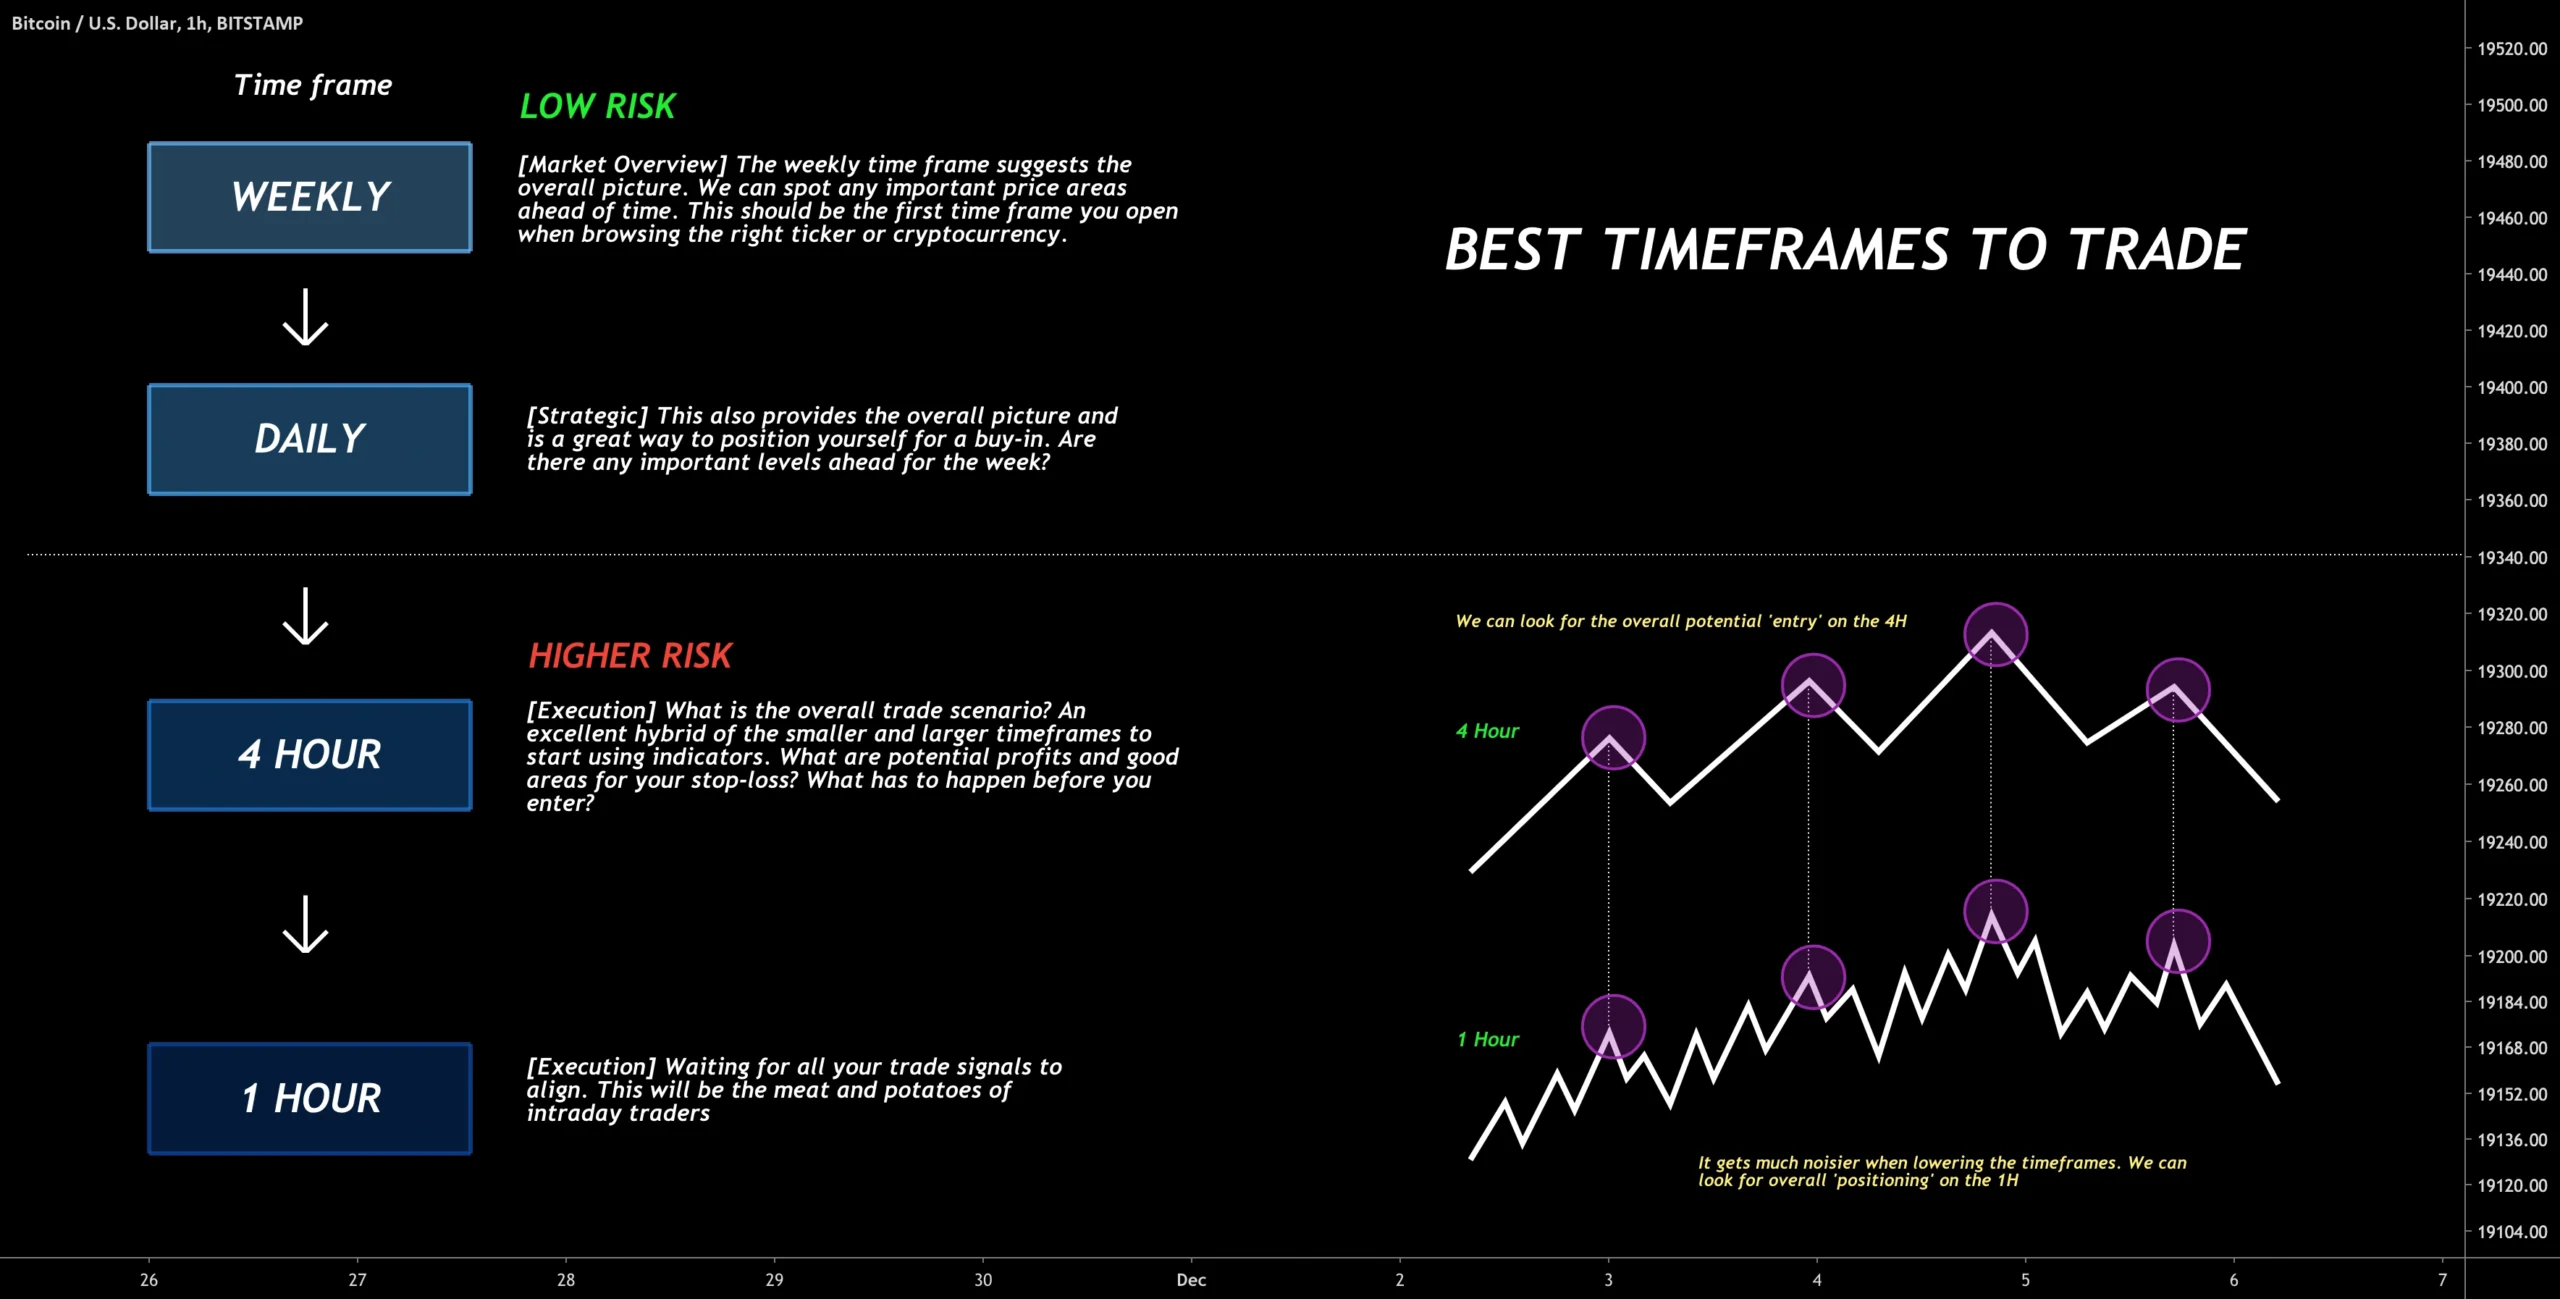
Once your chart loads, you can choose the timeframe. Want to see how a stock performed today? Try the 5-minute or 15-minute chart. Curious about long-term trends? The daily or weekly view offers a broader picture. For forex charting, timeframes like 1-hour or 4-hour are common.
These basic tools—symbol search and time adjustment—are your starting point in understanding price behavior.
Drawing on the Chart: Marking Zones and Observations
One of the most hands-on features of TradingView is its drawing toolset. You can draw horizontal lines to mark support or resistance levels, sketch trendlines to follow price direction, or apply Fibonacci tools to anticipate potential retracements.
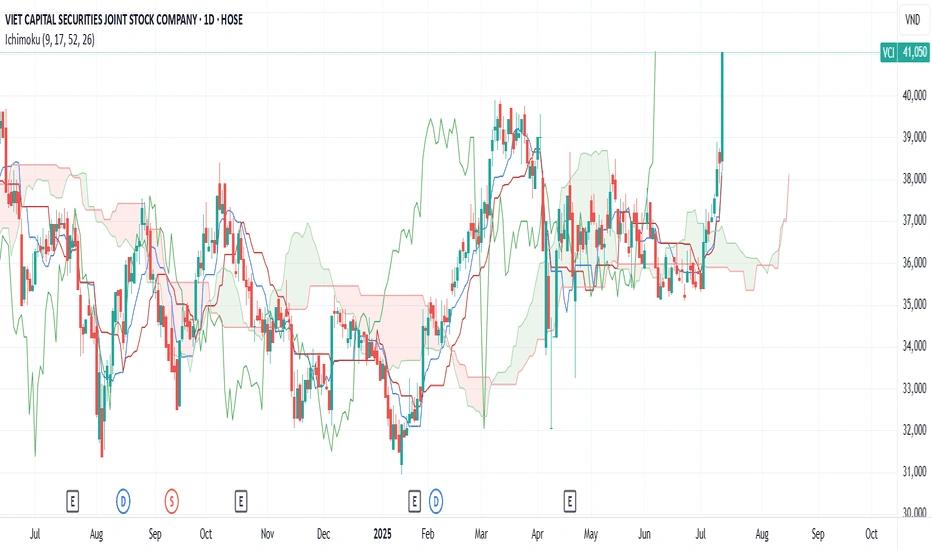
These visual cues help beginners focus. For example, if you notice that the VN-Index keeps bouncing off a certain level, drawing a line there makes it easier to monitor it in the future. Over time, your chart becomes more than just data—it becomes a map of your thoughts and observations.
Indicators: Your Technical Toolbox
Indicators are mathematical tools that help traders interpret price action. TradingView gives you access to hundreds of them—some classic, some experimental.
When you click on “Indicators” in the menu, you’ll see:
- Built-in indicators like RSI (Relative Strength Index), MACD, and Bollinger Bands
- Community Scripts, created and shared by users—these often offer creative or advanced ways to look at the market
- Financials, more relevant for analyzing company fundamentals (like PE ratios or earnings)
For Vietnamese users focusing on forex or local stocks, a combination of Moving Averages and RSI is a common starting point. You can test different setups and save what works for you.
Tip: Less is more. Many beginners overload their charts with too many indicators. Start with one or two and learn how they behave in real time.
Saving Workspaces and Creating Profiles
If you plan to follow both forex and Vietnamese stocks, TradingView lets you save different chart layouts. You might create one workspace for major forex pairs like USD/VND, EUR/USD, and another for local stocks like VIC or MWG.
Every saved layout remembers your drawings, chart styles, and indicators—so you don’t have to start over each time. This helps you stay organized, especially as you begin to build your own analysis habits.
The Local View: Why TradingView Is Popular in Vietnam
Credit from TradingView
Over the past few years, Vietnamese traders—both new and experienced—have embraced TradingView as a core analysis platform. The reasons are practical:
- Many local brokers don’t offer advanced charting, so TradingView fills that gap
- It supports VN market data and offers charting in Vietnamese
- There’s a growing online community sharing TradingView layouts, scripts, and tutorials in Vietnamese forums and social media
For beginner investors in Vietnam, this ecosystem makes it easier to learn. You’re not doing it alone.
Final Thoughts: Start Small, Stay Curious on TradingView Tools
TradingView tools offer a powerful way to begin your journey into chart reading and market analysis. While the platform has depth, beginners don’t need to use everything at once. Start with the basics: one market, one chart, one timeframe. Draw a few levels. Try one indicator. Watch what happens.
With time, your screen will no longer feel like a foreign language—it will feel like your own personal analysis desk. And whether you’re trading the VN-Index or exploring forex charting for the first time, you’ll know exactly where to look.